Matlab2Tikz: Perfect MATLAB Figures in LaTeX
 Papers and reports can’t do without both but integrating MATLAB figures in LaTeX is not so obvious. Different methods for exporting and including graphics exist but have various downsides like inconsistent scaling, wrong fonts and strange spacing. The best method I have come across so far is using matlab2tikz. It is a MATLAB script that is able to extract all relevant details out of a figure and convert it to PGFPlots (a LaTeX package).
The greatest benefits of using matlab2tikz instead of exporting and including graphics like png-, eps- and pdf-files are:
- Plot style adapting to document style (fonts and colors)
- Scaling, font-size, location of ticks and line-sizes independent of output figure size
- Textual representation allows for efficient source management using Git of subversion
- All vector figures for best quality and often lower file size
Matlab2Tikz also works with Octave, a free open-source and MATLAB alternative that is largely compatible with the MATLAB syntax. Get yourself into Octave with the GNU Octave Beginner’s Guide.
Obtaining and including the scripts
The process is simple, first obtain a copy of the matlab2tikz scripts. If you have installed Git it is as simple as:
cd ~/Documents/MATLAB
git clone https://github.com/matlab2tikz/matlab2tikz.git
Now start-up MATLAB and add the src folder of the script to your path, either visually or using the command:
addpath('./matlab2tikz/src/');
Creating a simple figure
The scripts are now on your path so that the matlab2tikz and cleanfigure commands can be called. First, a figure is made in MATLAB, then it is exported using matlab2tikz and finally the output size will be considered.
Creating a MATLAB figure
Let’s start with a simple figure:
t = linspace( 0, 0.1, 100 );
y = 325 * cos( 50 * 2 * pi * t );
plot( t, y, '-x' );
xlabel('Time (s)');
ylabel('Voltage (V)');
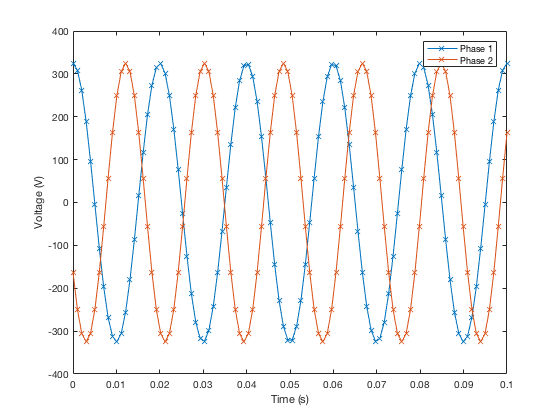
This creates a simple plot of something that could be called the voltage on a single-phase household electrical outlet. Why not add some more data to this plot?
y2 = 325 * cos( 55 * 2 * pi * t + 2/3 * pi );
hold on;
plot( t, y2, '-x' );
legend('Phase 1', 'Phase 2');
The resulting figure looks as follows:
Exporting using matlab2tikz
While the figure is still opened, we can use the matlab2tikz function. The basic command is:
matlab2tikz('myfigure.tex');
The first argument is the output filename. The result is saved to this file. Move the file to any place inside your LaTeX document to allow for including it.
Using the exported figure in your document
The matlab2tikz function is able to export either to TikZ figures for inclusion in documents or to standalone tex-files for testing the compiled output.
Two things are important: including the right packages and including the generated tex file the right way. To include the right packages ensure you have the following in the header of your document:
\usepackage{tikz}
\usepackage[utf8]{inputenc}
\usepackage{pgfplots}
\usepackage{pgfgantt}
\usepackage{pdflscape}
\pgfplotsset{compat=newest}
\pgfplotsset{plot coordinates/math parser=false}
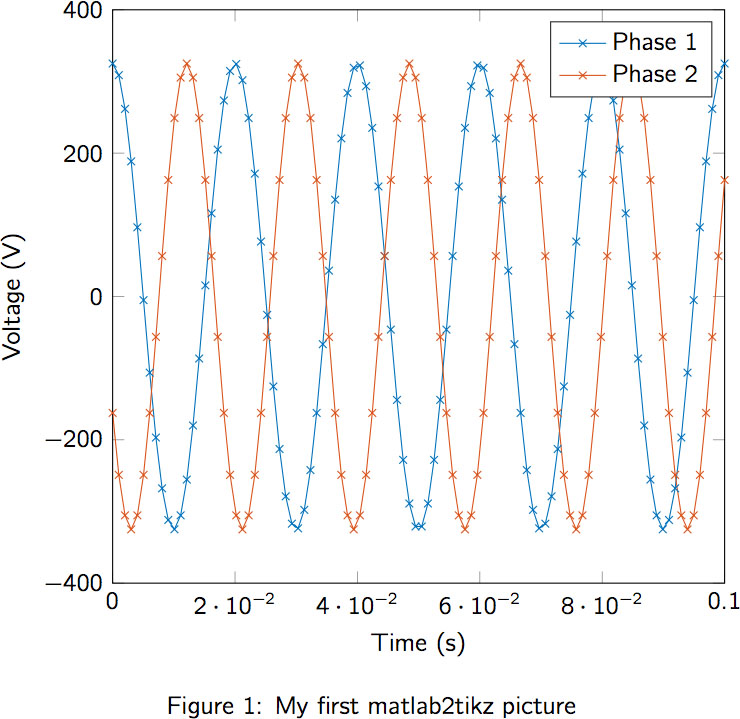
Now include the figure in the document:
\begin{figure}
\centering
\input{figures/q3b.tex}
\caption{ My first matlab2tikz figure }
\label{fig:myfirstfig}
\end{figure}
Compile your file and view the result! For testing it might be handy to export a standalone .tex file from MATLAB. This can be done using the following call:
matlab2tikz('myfigure.tex', 'standalone', true);
The resulting file is directly compilable.
Setting the width/height of the image
Setting a custom width and/or height is easy. Add the following pair to the matlab2tikz command in MATLAB:
matlab2tikz('myfigure.tex','width', '\fwidth' );
Then, in your LaTeX file, add the following in the header:
\newlength\fwidth
Now you can set the image width in the figure environment:
\begin{figure}
\setlength\fwidth{0.5\textwidth}
% remaining part of the image
\end{figure}
The result looks as follows:
Reducing filesize using cleanfigure
All existing plot-points will be exported to the TikZ figure, this means that the output size can become really large when a lot of points and/or lines are present. Also, compilation becomes slower as the number of points in a TikZ figure increases. In the matlab2tikz package, a function cleanfigure is supplied as well. This function is able to reduce the number of plot points to improve the filesize of the exported figure.
Execute the following function before exporting using the export function:
cleanfigure('minimumPointsDistance', 0.1)
Choose a relevant value. You will see the result instantaneously so evaluating is easy.
Sponsored content